.png?width=200&height=100&name=FJ%20white%20colour%20(400%20x%20200%20px).png)
Asset Benchmarking
The asset benchmarking report enables you to compare machines, cells or factories. You can compare their energy use, carbon footprint, the cost of the energy used by them and also an energy efficiency metric.
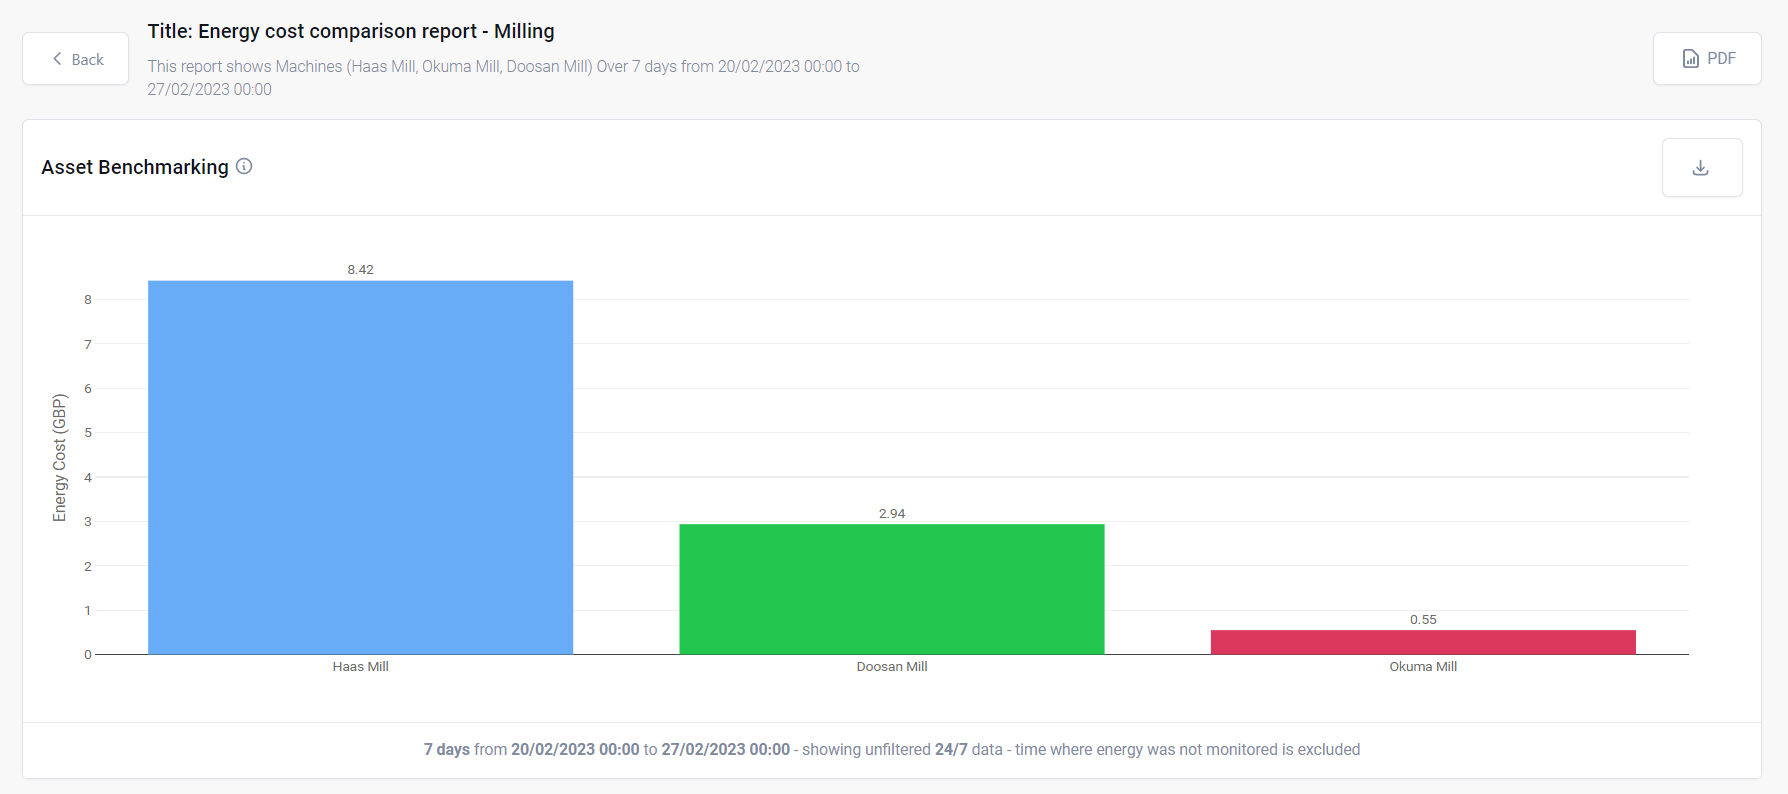
You can edit the report to choose which assets you want to compare, and over what timeframes. You can also choose which metric to show and whether to include only in shift time.
View how each of the metrics is calculated here.
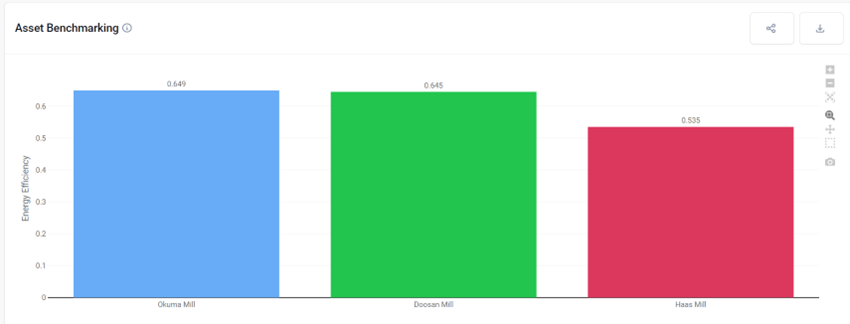
Energy Efficiency
Machines use energy to make stuff. So, when looking at energy consumption, there is a difference between energy used while the machine is doing its job (uptime) and when it is just idling, waiting for maintenance or while an operator is on a break. FourJaw's energy efficiency metric combines productivity and energy data. By ranking machines on Uptime divided by Energy used over a period, the least efficient machines can be highlighted and energy-saving actions implemented, whether by performing maintenance on the machine or training an operator.
Consumption Trend Report
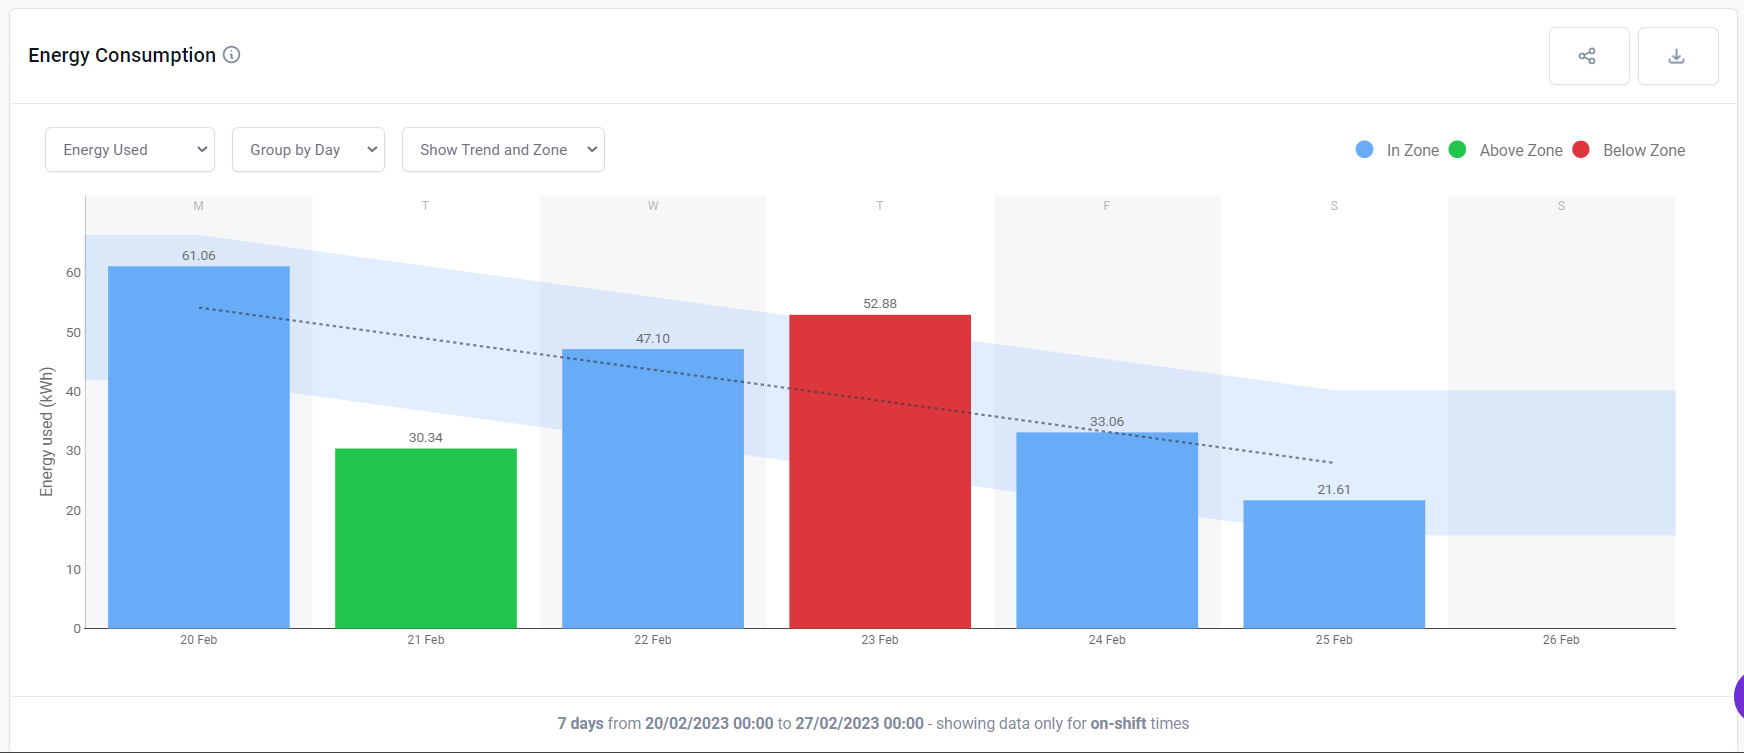
Using the consumption trend report allows you can see longer-term trends in energy consumption and the associated cost and carbon footprint.
Reducing Electricity Cost
Companies using large amounts of energy now have half-hourly electricity meters. Electricity firms are pricing energy dynamically each half hour, to try and balance electricity demand and production from renewable sources.
Companies that use large amounts of energy can save money by shifting their energy usage to times of day when it is cheaper, e.g. putting on a night shift.
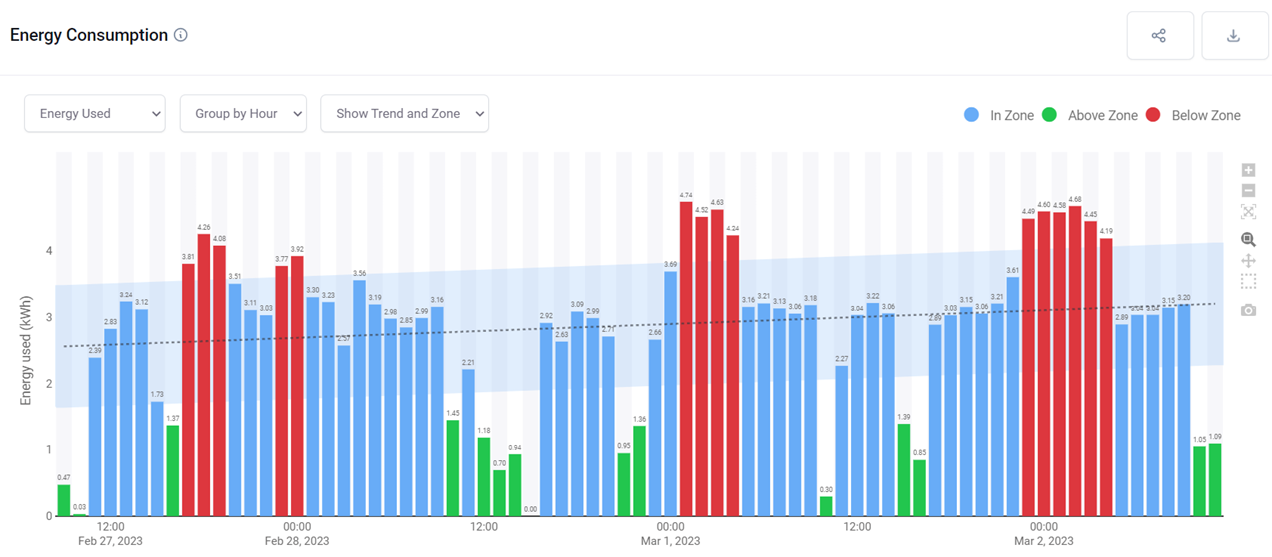
By reporting energy consumption by the hour, you can see progress in shifting high-energy intensity processes to different times of the day.