.png?width=200&height=100&name=FJ%20white%20colour%20(400%20x%20200%20px).png)
Trend Over Time
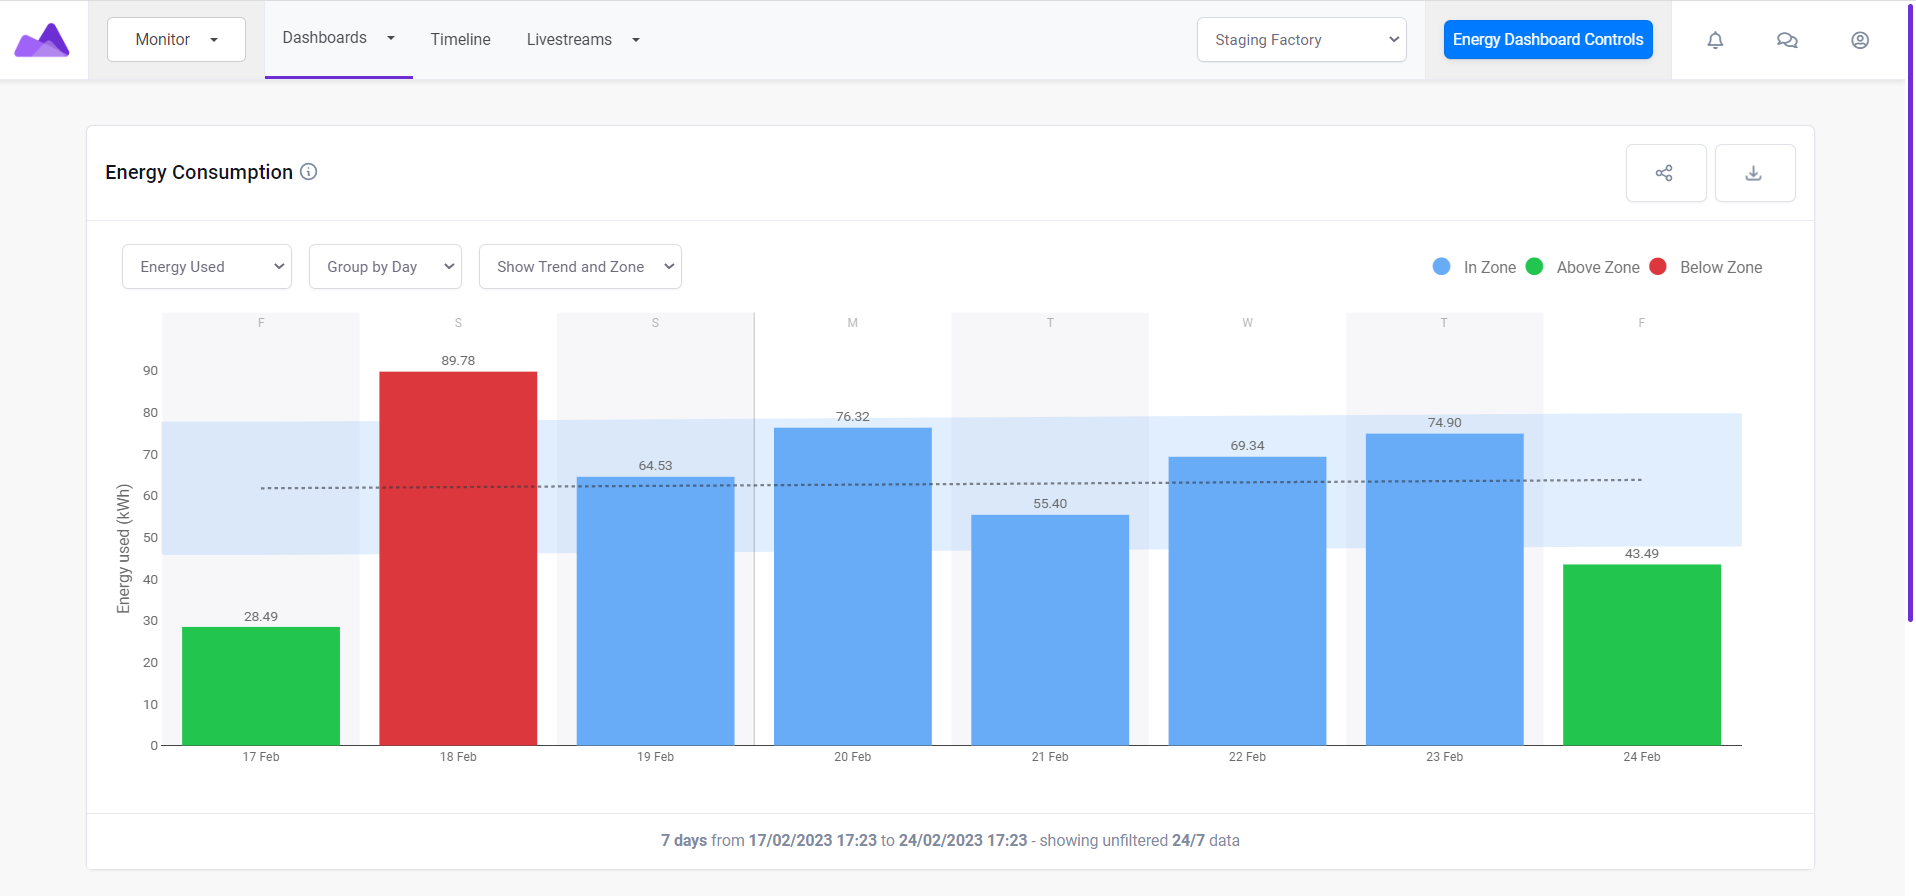
At the top of the energy monitoring dashboard, you can see how much energy was used each day or hour over a period of time. Using the drop-down menu you can instead see Carbon Footprint or cost. Read about how these are calculated here. In Dashboard Controls, you can configure this chart to show the factory, cell or machines you are interested in. You can also choose the timeframe it covers and whether or not only to show on-shift energy usage.
Energy Efficiency
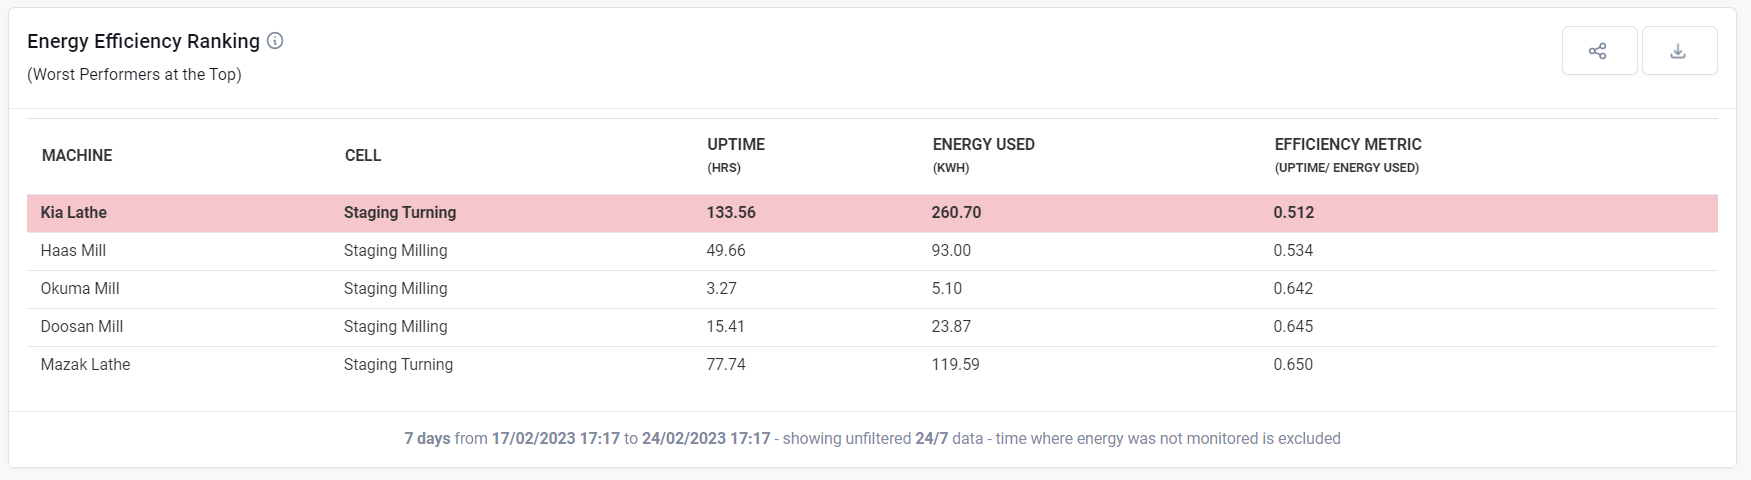
Energy use is ok if it is productive, and some machines, for example, a furnace, will inherently use more energy than others. It is the energy used during downtimes and out-of-shift that can potentially be minimised and needs to be highlighted.
FourJaw's Energy Efficiency Metric combines energy use and productivity data to rank machines by energy efficiency. This table lists up to 10 machines, you can configure which machines it shows by choosing the factory, cell or machine at the top of the page. It will show the worst performers, with the worst, the one that uses the most energy for the least uptime, at the top of the list.